Locking systems for lockers
 Sales report is a convenient tool for managers and owners to monitor and analyze sales data in detail. Sales report is located under Sales module.
Selecting the period
By default the sales report will show sales for the current day. Common periods for generating reports are available as buttons when clicking on the period window.
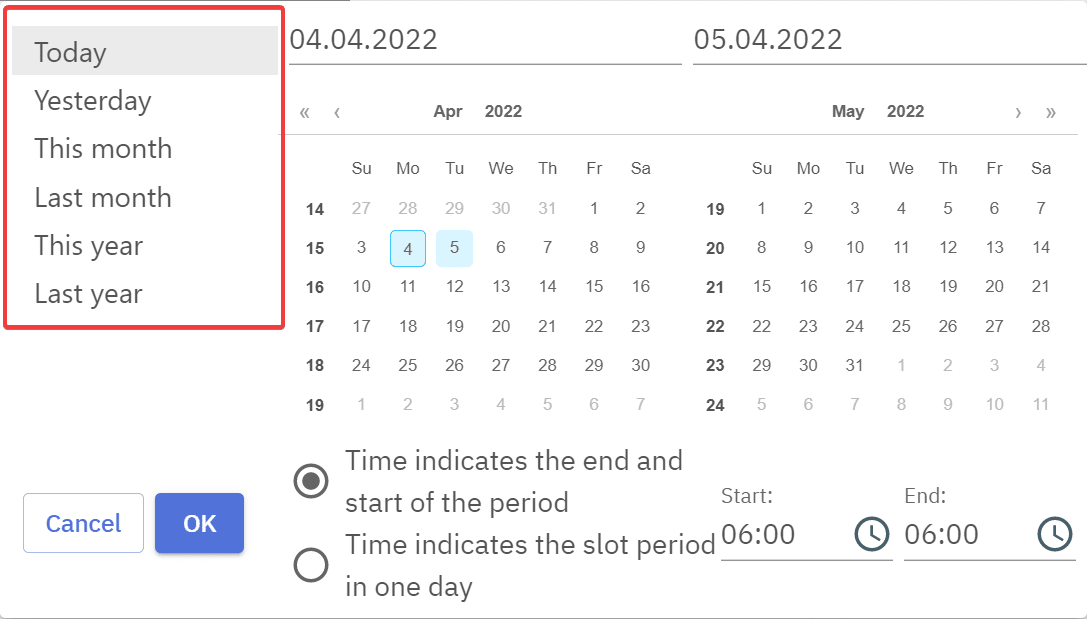
Selecting a specific period can be done by clicking on start date and then clicking on the end date. By default the time is set as the start of the begin date and end of the end date. To see a report for an exact time period over selected dates e.g. from 8 o’clock from 10 o’clock over a period of a month, “Time indicates the slot period in one day” has to be selected.
Generating the report
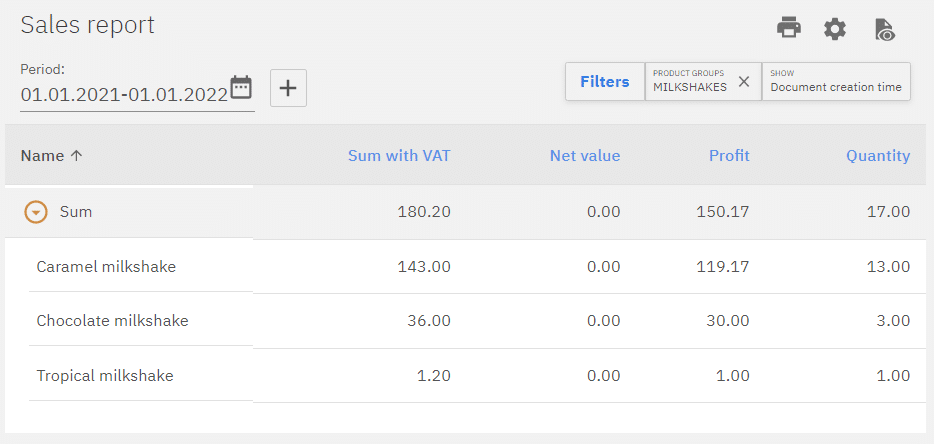
After the period is set clicking the “OK” will generate the summary report for the selected period.
Report can be detailed using filters which can be found the right side.
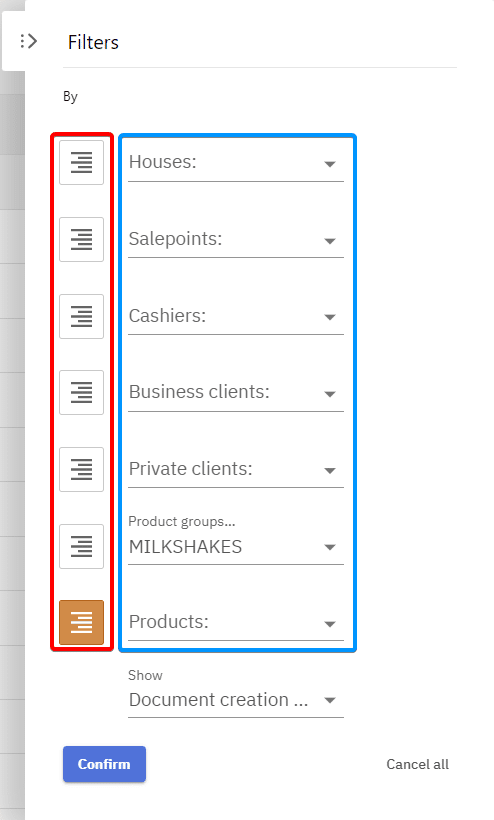
To filter result different options outlined in blue can be selected, outlined in red is grouping functions. As displayed in the image the report would be filtered to only include sales of the products under Milkshakes product group and the results would be grouped or listed by product name.
Comparing the results of different time periods
Comparison view can be activated by clicking the “+”.
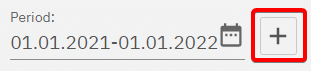
An extra period window will appear which is for the comparative period. The example is set to compare the current year and last year sales of Milkshakes.
As the report is grouped by product name it can be expanded to also show product names.
Editing the layout of the report
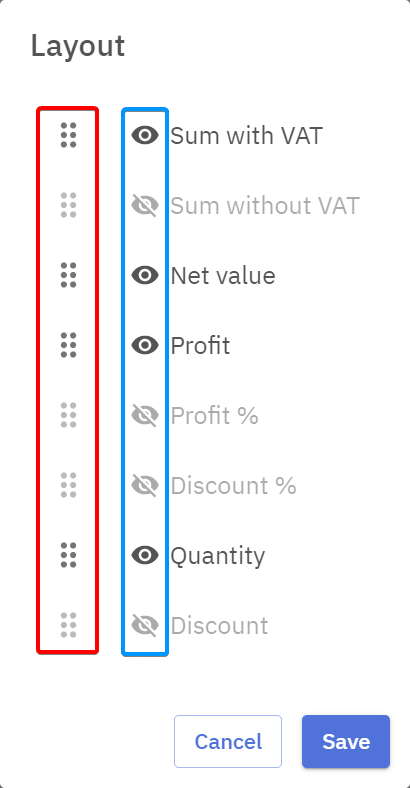
The report is represented as a table and the order and appearance of the columns can be edited by pressing the gear icon.

A window will pop up where the layout can be set. Eye icon (blue) is to set the visibility of the column, and dots (red) are to edit the order of the columns by dragging them. Pressing “Save” will save and apply the set layout.
Saving the report configuration
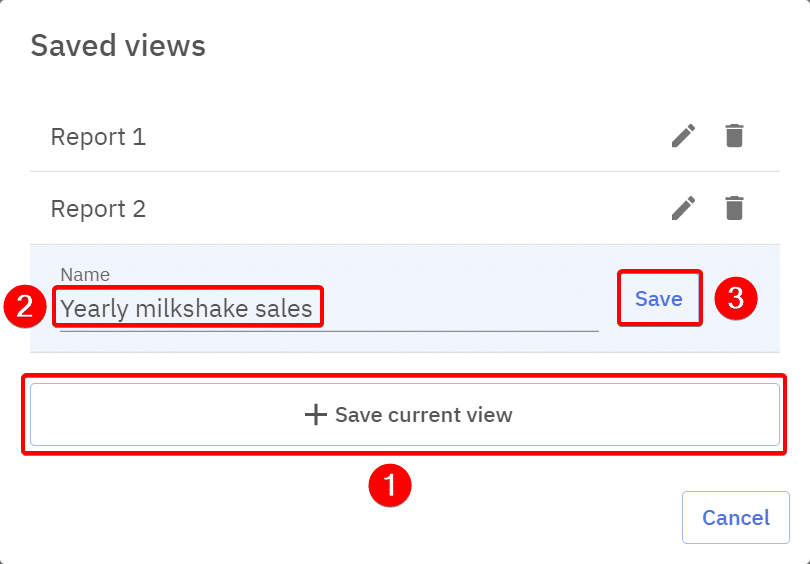
Report configurations can be saved by clicking on the “Saved views” button, so it’d be easy to load them later on.

This opens up a window containing previously saved views which can be loaded by clicking on them. From there they can also be deleted or edited. By pressing “Save current view” the current report configuration including filters, grouping and layout will be saved.
Sorting the data on the report
The report can be sorted based on all the columns by clicking on them.
Printing and exporting the report
When the report is done it’s possible to print it or save it directly on the device. Supported formats are .PDF, .CSV and .XLSX.