Locking systems for lockers
 Dashboard provides short summary reports for managers and owners, keeping them updated on sales-related topics and allowing them to make decisions accordingly. Dashboards are easy to use regardless of the device.
Dashboards
The dashboards module allows the user to create multiple dashboards for different types of reports. For example creating separate dashboards for different locations and a separate dashboard which combines all locations’ data for an general overview. It’s also possible to split dashboards based on they type of data they display, like amount of customers, specific time periods or users’ sales.
Dashboards can be created by people who have the permission to do so and the data on them can be seen only by people who are allowed to view the salepoint’ sales.
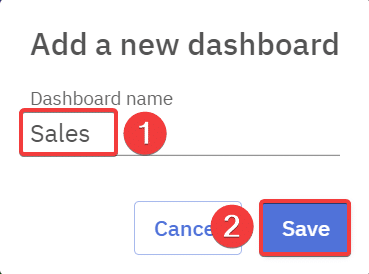
Creating a dashboard

Widgets
Widgets can be added to a dashboard to create and visualize reports using graphs.
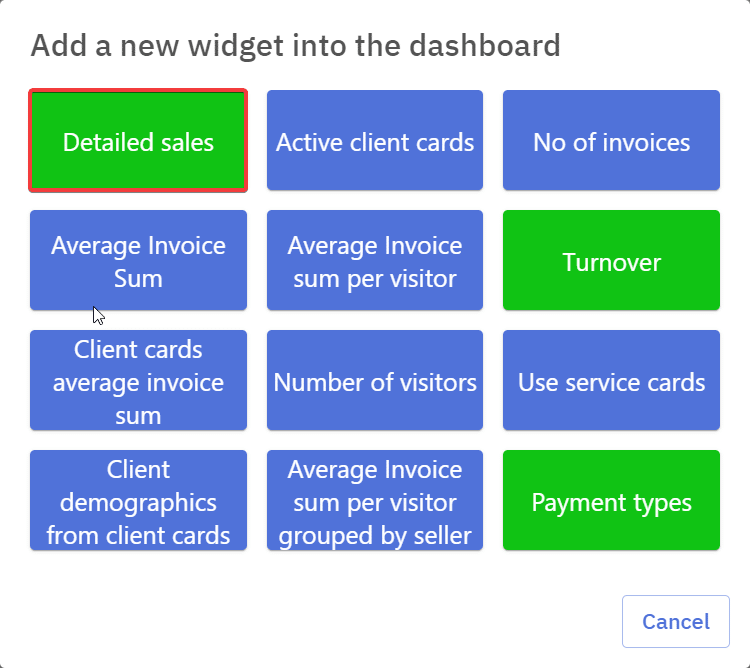
- Widgets are created by selecting “+” on a dashboard

- Widget type can be chosen from a range of different presets, for this example we’ll be selecting “Detailed sales”.
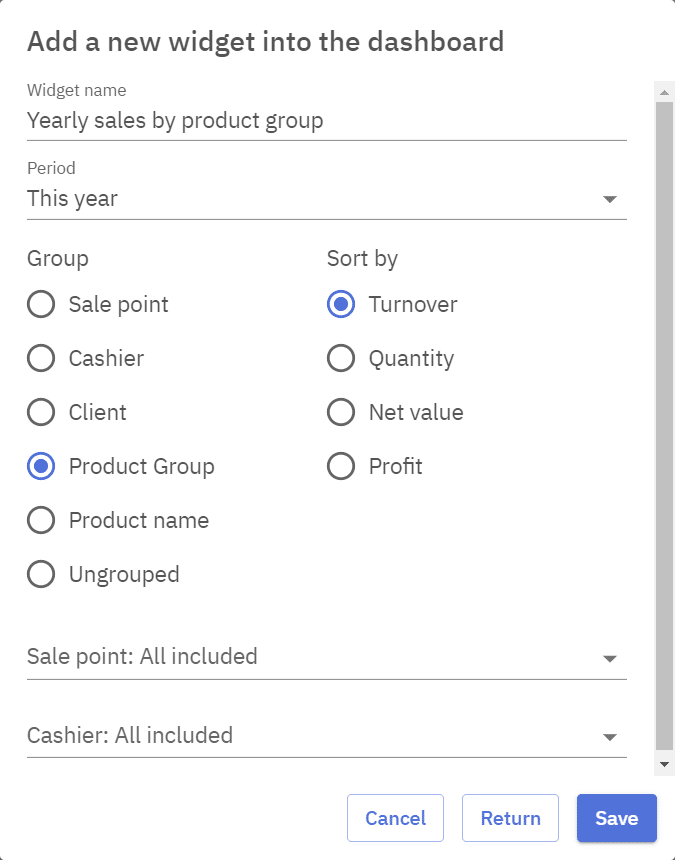
- After selecting the type additional configuration can be done.
- Name of the widget should describe it’s function
- Period sets the timeframe for the widget
- Grouping is used for graph view of the widget and adds additional detail to the widget
- Widget graph can be sorted based on different parameters
- Widget can be set to show the data of a specific salepoint under “Salepoint” selection
- “Cashier” can also be selected to focus the widget on a specific workers sales.
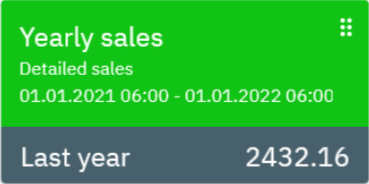
- After saving the widget appears on the dashboard, by default it will show the total sum based on the configuration
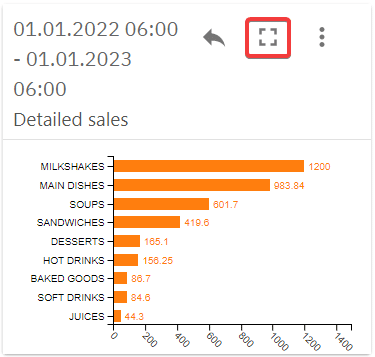
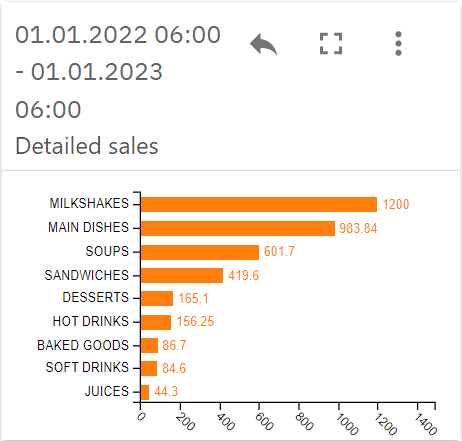
- By clicking on it, the widget will display a graph view of the data
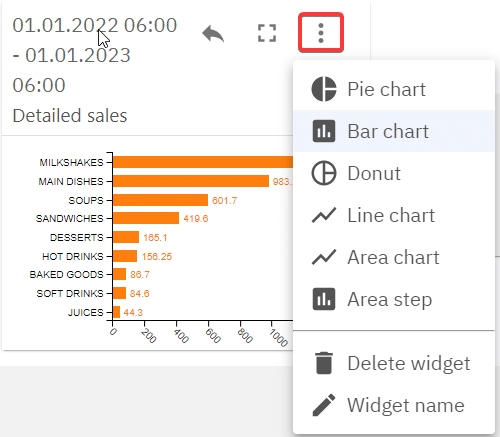
- It’s possible to switch graph types in the widget settings menu, from there the widget can also be either renamed or deleted
- The graph view of the widget by default will show the top results, any results not displayed can be seen by pressing the full screen button which opens up the widgets’ full view including all the results, from there the widgets’ configuration can edited